Photography basics - using the camera histogram, part 2
⇐ ⇐ ⇐ Photography basics - the camera histogram part 1If you've read the camera histogram - part 1, you already have one of the key photography basics.
Here I've illustrated how the histogram changes, using an example - three photos of the same scene; one over-exposed, one under-exposed, and one spot on!
If there's nothing unusual about your scene ...
If you know there is nothing unusual about the photo you're taking, but the camera histogram is skewed one way or the other, it indicates that the photo is either under-exposed or over-exposed.When you look at the photo on the camera's LCD screen you might not think a photo is over or under-exposed. This can be deceptive for a number of reasons:
- If it's a bright day and you're outside taking photos the screen will be difficult to see properly.
- Also, if outside, your eyes will have adjusted to the bright light levels outside and you might think the scene looks ok but once inside when your eyes have adjusted back the photo may be over exposed.
- If you're inside, the photo might be underexposed, but you don't realise it because your pupils will have opened up to adjust to the low light levels.
- If you've got the camera screen brightness turned up (or down), it will make the photo appear brighter (or darker), than it actually is.
The histogram, on the other hand, will never lie!
The photos below show the same scene and its corresponding histogram showing over and under exposure:
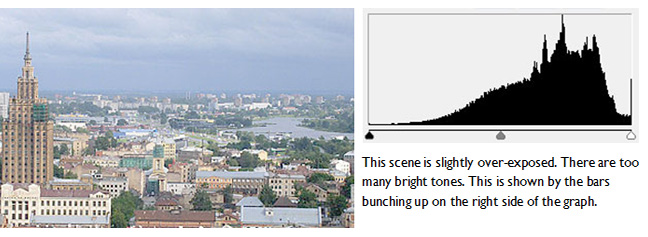
In this first photo, the image is too bright - it's over-exposed. This wouldn't have been easy to check because it was taken outside and with all the light shining on the screen it's almost impossible to tell if the photo is exposed correctly.
However, one look at the camera histogram tells us that the photo is over exposed - we can see this because the graph is pushed up towards the right-hand side, the bit that shows bright areas of the photo.
So, the first of our photography basics, if the camera histogram is bunched up on the right side, your photo is over-exposed!

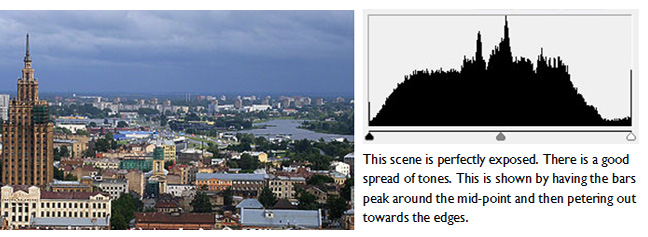
In this second photo we've got it spot on! Again, for all the reason given above, this wouldn't have been easy to check at the time. But the camera histogram doesn't lie - there's a 'bell-shaped' curve, and that means we've got a good exposure.
Another of our photography basics here - it doesn't have to be a perfect curve.
In fact, it's unlikely to ever be a perfect curve, so you have to take a general overview of the camera histogram.
There are a few bits on both the right and left side of the graph (the bright and dark sides respectively), but most of the tallest bars on the graph are in the middle section - just what we're looking for to get a good exposure.

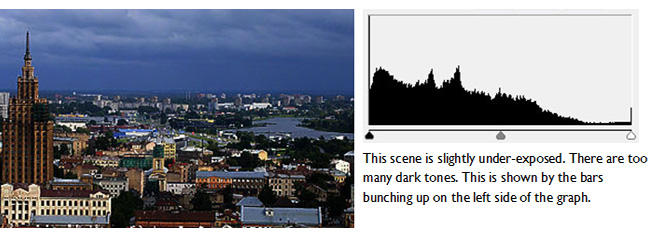
In this final photo, the image is too dark - it's under-exposed. If you were outside in the daylight,this wouldn't have been easy to check. The only way to properly tell if it's correctly exposed is to use the camera histogram.
So, looking at the camera histogram (next to the photo) we can see that the graph is pushed up towards the left-hand side, the bit that shows dark areas of the photo.
The graph clearly shows that the image is too dark.
So, that covers one of the key photography basics - how to check if your photos are correctly exposed.
Of course, remember that, if your photo has lots of white in it, or lots of dark areas, you would expect the camera histogram to show that.
- Lots of white - graph is larger towards the right side,
- Lots of dark areas - graph is larger towards the left side.
Photography basics - the camera histogram part 1 ⇒ ⇒ ⇒
